Feeling overwhelmed by the vast and complex topic of population in your Class 12 Geography exam? Worry not! This blog post is your one-stop guide to mastering everything you need to know about population distribution, density, growth, and composition.
Dive deep into the intricacies of Chapter 1 from the NCERT textbook "India People and Economy," often considered the foundation of your Geography understanding. We'll provide clear explanations and insightful answers to all the important questions you might encounter in your 2023-24 board exams.
But that's not all! To solidify your knowledge, we've got a downloadable PDF packed with all the questions and answers discussed here. So, buckle up and get ready to conquer the population chapter with confidence! Remember, mastering this chapter sets you on the right track for acing your Class 12 Geography exams.
| Class | 12 |
| Board | CBSE & State Boards |
| Subject | Geography |
| Book | India People and Economy |
| Chapter No. | 1 |
| Chapter Name | Population (Distribution, Density, Growth, and Composition) |
| Content Type | Important Questions and Answers |
Population (Distribution, Density, Growth, and Composition) Class 12 Geography Questions Answers
Q. No. 1) Multiple Choice Questions (MCQs)
i. Consider the following statements: “India has a highly uneven pattern of population distribution.”
- A. Uttar Pradesh has the highest population followed by Maharashtra.
- B. Top 10 states together account for about 90 percent of the total population of the country.
- C. The regions falling in the river plains and coastal areas have dense population concentrations.
- D. The interior districts of southern and central Indian States, some of the northeastern have high population concentration.
Of these statements –
a. A, B, C, and D are correct.
b. A, B, and C are correct.
c. A and C are correct.
d. B and D are correct.
Ans. Option (c)
ii. Consider the density of the population in the following states:
- West Bengal
- Bihar
- Kerala
- Uttar Pradesh
Select the correct sequence in order of DECREASING importance in the density of the population.
a. 1, 2, 3 and 4
b. 1, 3, 4 and 2
c. 2, 4, 3 and 1
d. 2, 1, 4 and 3
Ans. Option (d)
iii. Which one of the following states has the highest density of population in India?
(a) West Bengal
(b) Uttar Pradesh
(c) Kerala
(d) Punjab
Ans. Option (b)
iv. Which one of the following Union Territories has the highest density of population?
a) NCT Delhi
b) Andaman and Nicobar Island
c) Chandigarh
d) Puducherry
Ans. Option (a)
v. Consider the following and choose the correct answer with the help of given codes
| STAGES OF POPULATION | GROWTH FEATURES |
| I. Period between 1901 to 1921 | 1. Period of steady growth |
| II. Period between 1921 to 1951 | 2. Phase of stagnant growth of Population |
| III. Period between 1951 to 1981 | 3. High but decreasing growth rate |
| IV. After 1981 till present | 4. Period of population explosion |
Options
| I | II | III | IV | |
| a | 1 | 2 | 3 | 4 |
| b | 2 | 1 | 4 | 3 |
| c | 4 | 3 | 2 | 1 |
| d | 2 | 1 | 3 | 4 |
Ans. Option (b)
vi. Which one of the following periods witnessed rapid growth of population?
a. Before 1921
b. 1921 - 1951
c. 1951 – 1981
d. After 1981
Ans. Option (c)
vii. Which one of the following is the main reason for male migration in India?
a. Education
b. Business
c. Work and employment
d. Marriage
Ans. Option (c)
viii. It is noticed that the linguistic regions in the country do not have a sharp and distinct boundary, rather they gradually merge and overlap in their respective frontier zones.
(Source: NCERT)
Which of the following is the DIRECT cause of the blurring linguistic boundaries in India?
a. population explosion
b. high population migration
c. change in population pattern
d. genetic variety in the population
Ans. Option (b)
ix. Which one of the following is the largest linguistic group of India?
a. Sino – Tibetan
b. Austric
c. Indo – Aryan
d. Dravidian
Ans. Option (c)
x. Which one of the following figures represents the working age group of the population?
a. 15 to 65 years
b. 15 to 64 years
c. 15 to 66 years
d. 15 to 59 years
Ans. Option (d)
xi. Population of India according to their Occupation can be categorized into:
a) Main workers, Marginal workers, Non workers
b) Marginal workers, Household industrial workers, Non workers
c) Non-workers, agricultural labourers, Marginal workers
d) Cultivators, Main workers, Marginal workers
Ans. Option (a)
xii. Why is the work participation rate generally higher in underdeveloped or developing nations?
(a) Underdeveloped nations often rely heavily on labour-intensive industries, leading to a higher demand for the labour force.
(b) Underdeveloped nations have a higher population density, resulting in more people seeking employment opportunities.
(c) Developing nations have a greater emphasis on leisure and less inclination towards workforce participation.
(d) Developing nations have well-established social welfare programs that discourage workforce participation.
Ans. Option (a)
xiii. Which one of the following policies is designed to look into the overall development of our large youth and adolescents?
a. National Policy for Digital India
b. National Population Policy
c. National Youth Policy
d. National Policy for Skill Development and Entrepreneurship
Ans. Option (c)
xiv. Which one of the following pairs is correctly matched?
a. Phase I (1901-1921): Period of high population growth
b. Phase II (1921-1951): Period of stagnant population growth
c. Phase III (1951-1981): Period of population explosion
d. Phase IV (1981-now): Period of declining population growth
Ans. Option (c)
xv. Which one of the following is responsible for slowing down of growth rate after 1981?
a. Decrease in death rates
b. Increase in death rates
c. Female illiteracy
d. Increase in mean age at marriage
Ans. Option (d)
xvi. The following table presents population growth rate in India.
| Year | Growth Rate (in comparison to last year) |
| 2022 | 0.68% |
| 2021 | 0.80% |
| 2020 | 0.96% |
Source- https://www.macrotrends.net/countries/IND/india/populationgrowth-rate
Which of the following can be MOST LIKELY inferred from the given data?
a. the death rate in India has been increasing
b. India has been witnessing huge outward migration
c. the birth rate in India has been more than the death rate
d. India has been witnessing huge temporary inward migration
Ans. Option (c)
xvii.
- Assertion (A): The states with larger percentages of workers are Himachal Pradesh, Sikkim, Chhattisgarh, etc.
- Reason (R): The work participation rate tends to be higher in the areas of lower levels of economic development.
a. Both A and R are true and R is the correct explanation of A
b. Both A and R are true and R is NOT the correct explanation of A.
c. A is true, but R is false
d. A is false, but R is true
Ans. Option (a)
xviii. Which one of the following is the smallest language group in India?
a. Punjabi
b. Manipuri
c. Tamil
d. Marathi
Ans. Option (b)
xix. The growth rate of population in India in the decade 1951 and 1961 was caused by
a. Annual birth rate, death rate and rate of migration
b. Annual birth rate and rate of out migration
c. Annual birth rate and death rate
d. Annual birth rate and rate of in migration
Ans. Option (a)
xx. It is noticed that the linguistic regions in the country do not have a sharp and distinct boundary, rather they gradually merge and overlap in their respective frontier zones.
(Source: NCERT)
Which of the following is the DIRECT cause of the blurring linguistic boundaries in India?
a. population explosion
b. high population migration
c. change in population pattern
d. genetic variety in the population
Ans. Option (b)
Q. No. 2) Extract-based questions
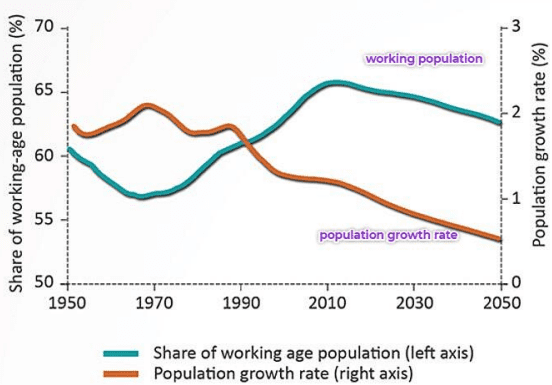
i. Which of the following can be inferred from the graph?
(a) the population is increasing fast but ageing slowly
(b) the population is increasing slowly but ageing fast
(c) the population is stagnant and ageing fast
(d) the population is increasing as well as ageing slowly
Ans. Option (b)
ii. Which of the following challenges are MOST LIKELY to arise soon due to, the trends depicted in the graph?
- P: decreased investment in education and skill development
- Q: decreased economic growth due to rising unemployment issues
- R: increased strain on healthcare systems and social welfare programs
- S: increased burden on the working-age population to support the elderly
(a) P and Q
(b) Q and R
(c) R and S
(d) P and S
Ans. Option (c)
iii. If this situation exists in country X, which of the following should be encouraged by X to promote sustainable economic growth in all sectors?
(a) promoting open immigration policies to facilitate the entry of foreign workers
(b) promoting technological advancements to automate tasks and increase productivity
(c) implementing policies to increase the retirement age and reduce social security benefits
(d) encouraging the emigration of elderly citizens to alleviate the strain on social welfare systems
Ans. Option (a)
Q. No. 3) Data Based Questions
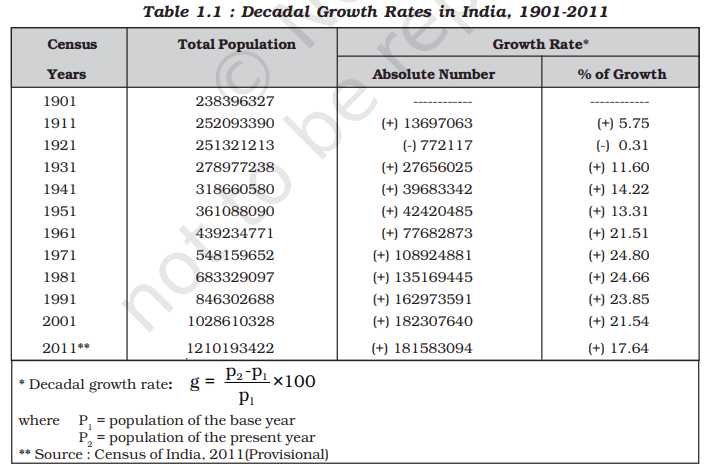
Data Based Questions
i. Which year has seen a negative population growth rate in India?
a. 1931
b. 1921
c. 1911
d. 1941
Ans. Option (b)
ii. What was the highest recorded growth rate of population in India?
a. 24.66
b. 24.80
c. 23.85
d. 21.54
Ans. Option (b)
iii. Which year has recorded the highest growth of population in India in terms of absolute numbers?
a. 2001
b. 2011
c. 1991
d. 1981
Ans. Option (a)
iv. How much population increase has been registered between the census years 1911 to census year 2011?
a. 900789600
b. 182307640
c. 181583094
d. 971797095
Ans. Option (d)
Q. No. 4) Fill in the blanks-
________________ and _______________ densities should be found out, in order to get a better insight into the human-land ratio.
Ans. Physiological and Agricultural
Q. No. 5) What does the proportion of literate population of a country indicate?
Ans. The proportion of literate population of a country is an indicator of its socioeconomic development because it shows the standard of living, social status of females, availability of educational facilities, and policies of government.
Q. No. 6) What is meant by the density of population? Explain with examples the physical and economic factors which affect population distribution.
Ans. The density of population is a measure of human and land relationship. It is expressed as the number of persons per unit area. It helps in getting a better understanding of spatial distribution of population in relation to land.
The physical factors like climate, terrain, and availability of water affects population distribution. For example the north 3 India plains, deltas, and coastal plains have a higher proportion of population than other regions of the country.
Economic factors like industrialisation, urbanisation, and development of transport networks cause high concentration of population in urban regions of Delhi, Mumbai, Kolkata, Bangalore, Pune, etc.
Q. No. 7) “An uneven distribution of population in India suggests a close relationship between population and physical and socio-economic factors.” Support the statement with suitable examples.
Ans. An uneven distribution of population in India suggests a close relationship between population and physical and socio-economic factors.
a. Physical factors such as Climate, Terrain, and Availability of water influenced and determined the pattern of the population distribution.
- Example 1: The North Indian Plains, deltas, and Coastal Plains have a higher proportion of population because they have a climate suitable for agriculture and fertile plains.
- Example 2: Mountainous and forested regions of southern and central Indian States, Himalayan states, and some of the north-eastern states are less populated.
- Example 3: Development of irrigation (Rajasthan), availability of mineral and energy resources (Jharkhand) and development of transport network (Peninsular States) have resulted in moderate to high proportion of population.
b. Socio-economic and historical factors also influence and determine the distribution of population of India.
- Example 4: Traditional settled agriculture and early human settlement has resulted in large population in the river plains and coastal areas of India.
- Example 5: Development of transport and better agricultural development has resulted in large population in North Plains.
c. The industrialization and urbanization also influenced the distribution of population.
- Example 6: The urban regions of Delhi, Mumbai, Kolkata, Bangalore, etc. have high concentration of population due to industrial development and urbanization. A large numbers of rural-urban migrants come to these towns.
Q. No. 8) Study the figure given below and answer the questions given below.
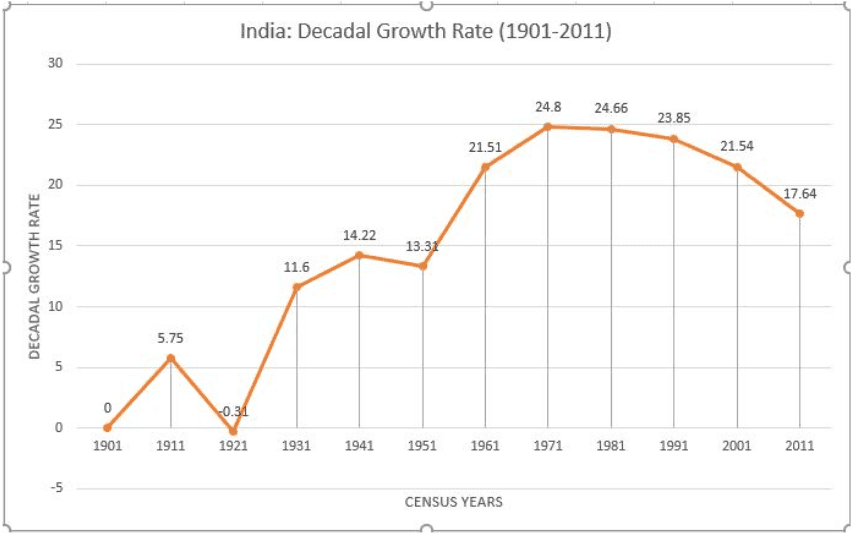
1. Which decade has shown the negative trend of growth rate of population?
2. Give one reason for the negative growth rate of population during this decade?
3. Mention any two decades in which the percentage decadal growth has shown the regular downward trend.
4. Explain any two reasons for the declining trend in the population growth rate.
Ans. (1) 1911-1921
(2) Poor health and medical services, illiteracy of people at large and inefficient distribution system of food and other basic necessities were largely responsible for a high birth and death rates in this period.
(3) Decadal growth has shown the regular downward trend.
- I.1971-1981
- II. 1981-1991
- III. 1991-2001
- IV. 2001-2011
(4) Two reasons for the declining trend in the population growth rate.
- Increase in the mean age at marriage.
- Improved quality of life.
- Improvement in the education of females
- Opting family planning programmes.
Q. No. 9) Study the graph showing the decadal growth rates in India and answer the questions given below.
a. Which census year had registered negative population growth and why?
b. Give reasons for decline in population growth since 1981.
Ans. a. 1921
b.
- A downward trend of crude birth rate is held responsible for such a population growth.
- Increase in the mean age at marriage.
- Education of females
Q. No. 10) What is the meaning of population growth? Describe two main features of the first phase of Indian demographic history.
Ans. Growth of population is the change in the number of people living in a particular area between two points of time. Its rate is expressed in percentage.
Population growth has two components namely: natural and induced.
Phase I:
- The period from 1901-1921 is referred to as a period of stagnant or stationary phase of growth of India’s population.
- In this period growth rate was very low, even recording a negative growth rate during 1911-1921 due to high birth rate and death rate.
- Poor health and medical services, illiteracy of people at large and inefficient distribution system of food and other basic necessities were largely responsible for a high birth and death rates in this period.
Q. No. 11) Explain the causes and consequences of Rural-Urban migration in India with suitable examples.
Ans. Migration is a response to the uneven distribution of opportunities over space.
There are two main types of factors which cause people to migrate.
- Push factors which cause people to leave their place of residence
- Pull factors that attract people from different places
In India people migrate from rural to urban areas due to push factors like poverty, high population, pressure on the land, lack of basic infrastructural facilities like healthcare, education, natural disasters such as floods, droughts, cyclonic storms, earthquakes, tsunami, wars and local conflicts.
The factors that attract people to urban areas are better opportunities, availability of regular work, relatively higher wages, better education, better healthcare and sources of entertainment.
Migration also has certain consequences like economic, social, demographic and environmental consequences.
○ Economic Consequences:
- A major benefit of migration is the remittance sent by the migrants
- Remittances from international migrants are a great source of foreign exchange.
- Punjab, Kerala, Tamil Nadu receive the highest remittances from international migrants
- Remittances are mainly used for food, repayments of debts, treatment, marriages, children’s education etc.
- Migration from rural areas of Punjab, Uttar Pradesh, Bihar and Odisha are due to the success of green revolution
- Unregulated migration to metro cities causes overcrowding. This is a negative consequence of migration as it causes the formation of slums.
○ Demographic Consequences:
- Migration leads to redistribution of population.
- Rural - urban migration contributes to the population growth of cities.
- Age and skill selective out migration from rural areas have adverse effect on the rural demographic structure.
- High male dominated out migration from rural areas of MP, Rajasthan, Uttrakhand, Maharashtra etc. has led to serious imbalances in the age and sex composition.
○ Social Consequence:
- Migrants act as agents of social change.
- New ideas related to new technology, family planning, girls’ education. etc. get diffused to rural areas through people.
- It has positive contributions such as the evolution of composite culture, widens the mental horizon of people etc.
- It also has negative consequences such as anonymity, and a feeling of dejection which creates social vacuum can lead to criminal activities and drug abuse.
○ Environmental Consequences:
- Overcrowding has put pressure on existing social and physical infrastructure in urban areas.
- Unplanned growth of urban settlement leads to formation of slums and shanty colonies.
- Overexploitation of resources, cities are facing acute problem of depletion of groundwater, air pollution, disposal of sewage and management of groundwater.
Q. No. 12) What are the features of National Youth Policy?
Ans. The National Youth Policy (NYP–2014) launched in February 2014 proposes a holistic ‘vision’ for the youth of India.
It aims “To empower the youth of the country to achieve their full potential, and through them enable India to find its rightful place in the community of nations”.
The NYP–2014 has defined ‘youth ‘as persons in the age group of 15–29 years.
Q. No. 13) Identify the challenges of the adolescent population before the society. Enlist a few measures to overcome these problems.
Ans. The share of adolescents (ages 10 -19) is about 20.9 percent of the population.
The adolescent population though regarded as the youthful population having high potential, is quite vulnerable if not guided properly.
There are many challenges for the society as far as adolescents are concerned such as, marriage at a young age, illiteracy (especially in females), school dropouts, low intake of nutrients, high rate of mortality of adolescent mothers, high rates of HIV/AIDS infections, physical or mental retardedness, drug abuse, alcoholism, juvenile delinquency, and committing crimes.
The government of India has undertaken certain policies to impart proper education to the adolescents so their talents are better channelized and properly utilised.
The National Youth Policy looks into the overall development of our large youth. It stresses on an all-round improvement of the youth and adolescents enabling them to shoulder responsibility towards constructive development of the country.
- It reinforces the qualities of patriotism and responsible citizenship.
- It aims to empower the youth in terms of their effective participation in decision-making and carrying the responsibility of an able leader.
- Special emphasis was given in empowering women and girl child to bring parity in the male-female status.
- Efforts were made to look into health, sports and recreation, creativity and awareness about new innovations in the spheres of science and technology.
Q. No. 14) How is the main worker different from the marginal worker? State the four occupational categories as categorized by the Census of India.
Ans. Main Worker is a person who works for at least 183 days (or six months) in a year.
Marginal Worker is a person who works for less than 183 days (or six months) in a year.
Occupational Categories are - The 2011 Census has divided the working population of India into four major categories:
- Cultivators
- Agricultural Labourers
- Household Industrial Workers
- Other Workers.
Also Read:
- Crush Secondary Activities with These Killer Questions & Answers!
- Demystifying Water Resources: Class 12 Q&A for Exam Success!
- Think Like a Pro: Primary Activities Q&A for Class 12
- Class 12 Land Resources and Agriculture: Questions You NEED to Know!
- Mastering Human Development: Ace Your Class 12 Geography!