Demystifying World Population: Dive into Class 12 Geography with Essential Questions and Answers!
Ah, Class 12 geography – a voyage through diverse landscapes and intricate human interactions. If you're currently navigating the fascinating world of "Fundamentals of Human Geography," then buckle up, because Chapter 2 is here to challenge and engage you!
This chapter delves into the intricate dance of World Population: its distribution, density, and growth. It's a crucial topic, not just for acing your exams, but also for understanding the complex dynamics shaping our planet. But fear not, intrepid explorer! This blog post is your trusty map, guiding you through the essential questions from Chapter 2 with clear and comprehensive answers.
Here's what you can expect:
- Precise Answers: We'll tackle the key questions found in Chapter 2 of "Fundamentals of Human Geography," providing detailed explanations and insights to solidify your understanding.
- Focus on Clarity: Whether you're a seasoned geography scholar or just starting your journey, our explanations are crafted to be clear, concise, and accessible.
- Beyond the Book: We'll delve deeper than just the textbook, incorporating real-world examples and relevant data to bring the concepts to life.
- Bonus Material: As a special treat, we'll provide a free downloadable PDF with all the questions and answers for easy reference and revision.
So, are you ready to conquer the mysteries of World Population? Grab your thinking cap, bookmark this blog, and let's embark on this exciting learning adventure together! Remember, the key to unlocking geographical knowledge lies in asking the right questions and seeking clear answers. And that's exactly what we're here for!
| Class | 12 |
| Board | CBSE & State Boards |
| Subject | Geography |
| Book | Fundamentals of Human Geography |
| Chapter No. | 2 |
| Chapter Name | The World Population (Distribution, Density and Growth) |
| Content Type | Important Questions and Answers |
The World Population (Distribution, Density, and Growth) Class 12 Important Questions Answers
Q. No. 1) Multiple Choice Questions (MCQs)
i. To calculate the population density of region X, which of the following factors will be directly or indirectly taken into account?
- P: total number of people who moved (immigrated) into the region
- Q: total number of people who moved out (emigrated) of the region
- R: total number of people who died in the region in the given year
- S: total number of people who were born in the region in the given year
(a) P and Q
(b) Q and R
(c) R and S
(d) P and S
Ans. Option (d)
ii. Which one of the following is not a Push factor?
a. Water Shortage
b. Medical/Educational facilities
c. Unemployment
d. Epidemics
Ans. Option (b)
iii. Which among the following is a push factor of migration?
a. Better job opportunities
b. Pleasant climate
c. High living conditions
d. Natural disasters
Ans. Option (d)
iv. Which of the following continents has the least percentage share in world population?
a. Africa
b. Europe
c. North America
d. Oceania
Ans. Option (d)
v. Relate the most important factor responsible for high density of population found in Katanga-Zambia Plateau located in Africa:
a) Availability of copper in abundance
b) Availability of forests resources
c) Close social ties
d) Scenic natural beauty
Ans. Option (a)
vi. Which of the following factors is mainly responsible for high density of population in Mediterranean regions from early periods of history?
a. Availability of water
b. Plain relief
c. Pleasant climate
d. Presence of Minerals
Ans. Option (c)
vii. The time taken by any population to double itself at its current annual growth rate is called
a. Growth of population
b. Natural growth of population
c. Population doubling time
d. Positive growth of population
Ans. Option (c)
viii. “The Kobe-Osaka region of Japan is densely populated.” Select the main reason.
a. Favourable climate
b. Industrialization
c. Urbanization
d. Government policies
Ans. Option (b)
ix. The following are events on the right side of the table that are associated with the demographic transition theory. Match them with the different stages of the transition stage listed on the left side.
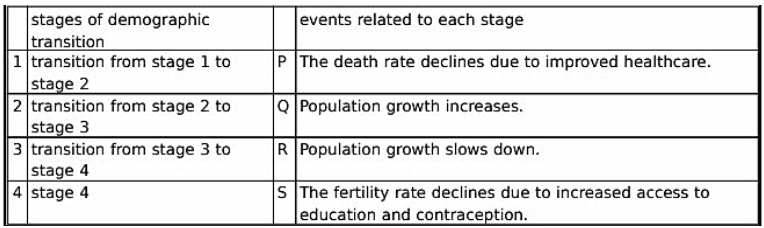
(a) 1 - R, 2 - Q, 3 - S, 4 - P
(b) 1- Q, 2 - S, 3 - R, 4 - P
(c) 1 - P, 2 - Q, 3 - S, 4 - R
(d) 1 - Q, 2 - S, 3 - P, 4 – R
Ans. Option (c)
x. Which of the following may be interpreted as a spontaneous effort to achieve a better balance between population and resources?
a. Migration
b. Growth Rate
c. Birth Rate
d. Death Rate
Ans. Option (a)
xi. Study the graph that shows the Demographic Transition Model. Using this information choose the correct option.
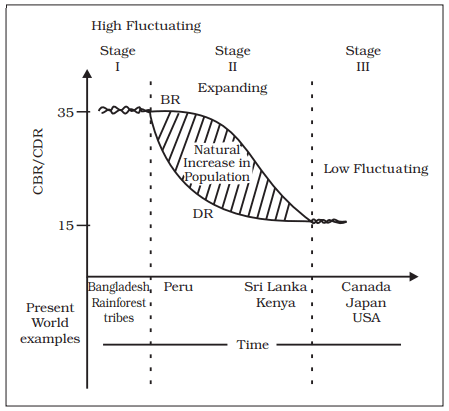
a. The first stage has high fertility and low mortality.
b. In the second stage fertility remains high and is accompanied by a reduced mortality rate.
c. In stage three both fertility and mortality increase considerably.
d. Canada, Japan, and the USA are in the high fluctuating stage.
Ans. Option (b)
xii. Which of the following features is related to the second stage of Demographic Transition Theory?
a. Fertility and Mortality decline considerably
b. Decline in Mortality but fertility remains high
c. Fertility and Mortality are high
d. Fertility declines and Mortality high
Ans. Option (b)
xiii. According to Malthusian theory, what would happen if an exponentially growing population exceeds its limit?
- P: The population will stabilise at a sustainable level.
- Q: The government will implement strict birth control measures.
- R: The population will experience a decrease in their living standards.
- S: The availability of resources will become insufficient to support the population.
(a) P and Q
(b) Q and R
(c) R and S
(d) P and S
Ans. Option (c)
Q. No. 2. Read the following graph and answer the questions given below:
i. How does the natural increase in population occur, as per the graph?
a. Birth Rate – Death Rate
b. Death Rate + Birth Rate
c. Growth Rate - Birth Rate
d. Birth Rate + Migration
Ans. Option (a)
ii. What does the transition from high fluctuating stage to low fluctuating stage indicate?
a. Shift from Urban Industrial economy to Rural Agrarian economy
b. Shift from Rural Agrarian economy to Urban Industrial economy
c. Low Birth and Death Rate to High Birth and Death Rate
d. Migration from Urban to Rural areas
Ans. Option (b)
iii. From the given graph, what condition can you infer about the least developed countries?
a. High Birth Rate and High Death Rate
b. Low Birth rate and Low Death rate
c. High Birth Rate and Low Death Rate
d. Low Birth Rate and High Death Rate
Ans. Option (a)
iv. In which stage of Demographic Transition, population explosion took place :
a. Stage I
b. Stage II
c. Stage III
d. Post Stage III
Ans. Option (b)
v. Why does fertility rate show a declining trend in the third stage?
a. This is because human beings are not able to adjust their fertility.
b. Literacy rates show a downward trend all over the world.
c. The population becomes urbanized and has high technical knowhow.
d. There is acute food shortage in countries with a high Human Development Index.
Ans. Option (c)
vi. Why are Fertility and Mortality rates high in the first stage of this theory?
a,. People have a lot of buffer stock as food security.
b. People reproduce more to compensate for the deaths due to epidemics.
c. People are highly educated at this stage.
d. There is technological advancement in all fields.
Ans. Option (b)
vii. What led to decline in Mortality rate in the second stage of this theory?
a. Due to improvement in Sanitation and Health conditions.
b. Due to insufficient supply of food grain that led to starvation.
c. Due to widespread illiteracy all over the world.
d. Due to unfavorable sex ratio prevailing in developing countries.
Ans. Option (a)
Q. No. 3) Define ‘Population density’. Explain any four geographical factors that affect the distribution of population in the world.
Ans. Density of population = Population/Area
Availability of water
- People live in areas where fresh water is easily available
- So river valleys are densely populated
- Ex.-Gangetic plains
Landforms
- People prefer living on flat plains and gentle slopes as it is favourable for agriculture and industrial development
- Mountainous and hilly areas hinder the development oftransport and so are less populated
- Ex.- Ganga plains are densely populated Himalayas are scarcely populated
Climate
- Extreme climate are uncomfortable of human habitation
- Areas with comfortable climate attract more people
- Areas with very heavy rainfall have low population
- Ex. Mediterranean regions are populated due to pleasant climate
Soils
- Areas with fertile soil are densely populated
- Ex. Gangetic plains
Q. No. 4) Differentiate between Positive and Negative Growth of population.
Ans.
| Positive Growth of Population | Negative Growth of Population |
| It happens when the birth rate is more than the death rate between two points of time or when people from other countries migrate permanently to a region. | It occurs when the birth rate falls below the death rate or people migrate to other countries between two points of time. |
Q. No. 5) Differentiate between immigration and emigration.
Ans. Immigration: Migrants who move into a new place are called Immigrants.
Emigration: Migrants who move out of a place are called Emigrants.
Q. No. 6) What does the proportion of literate population of a country indicate?
Ans. The proportion of literate population of a country is an indicator of its socioeconomic development because it shows the standard of living, social status of females, availability of educational facilities and policies of government.
Q. No. 7) Read the scenarios given below and answer the questions that follow.
(a) The people from the minority community in country X flee to the closest border countries due to the enforcement of majoritarian policies.
(b) The Aryans moved eastward to greener pastures in a cyclic exodus. Of the two scenarios, which one can be categorized as a push factor? Give two reasons for your choice.
Ans. Option (a) shows the push factor, because:
- fear of oppression and persecution
- evident lack of opportunities
- hostile living conditions.
Q. No. 8) Observe the table given below and answer the question that follows.
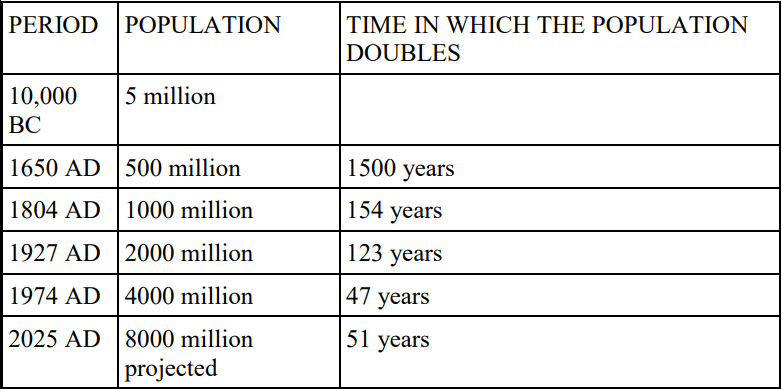
During which period did the world population double in the shortest time? Explain the reasons for this exponential rise in population.
Ans. 1927-1974 AD
Reasons for exponential rise in population:
- advancement in medical sciences
- improvement in technology for better diagnosis
- improved living conditions with better hygiene
- high employment and production increasing the demand for labour
Q. No. 9) With the help of a neat and labeled diagram, explain the three stages of the Demographic Transition Theory.
Ans. The three stages of the Demographic Transition Theory with diagram:
The above diagram explains the three-staged model of Demographic Transition Theory:
The first stage has high fertility and high mortality because people reproduce more to compensate for the deaths due to epidemics and variable food supply. The population growth is slow and most of the people are engaged in agriculture where large families are an asset. Life expectancy is low, people are mostly illiterate and have low levels of technology. Two hundred years ago all the countries of the world were in this stage.
Fertility remains high in the beginning of the second stage but it declines with time. This is accompanied by a reduced mortality rate. Improvements in sanitation and health conditions lead to decline in mortality. Because of this gap the net addition to population is high.
In the last stage, both fertility and mortality decline considerably. The population is either stable or grows slowly. The population becomes urbanized, literate and has high technical know-how and deliberately controls the family size. This shows that human beings are extremely flexible and are able to adjust their fertility.
Q. No. 10) “Access to family planning services is a significant factor in improving women’s health”. Give three points in support of your answer.
Ans. Access to family planning services play a positive role in the health of women’s health and can influence the positive outcomes such as:
- It helps in spacing or preventing the birth of children
- It improves the general health condition and help in pre and post-delivery of mother.
- It may help in increasing the age of marriage.
- It contributes positively in well-being of family and growth and development of children in the family.
Also Read:
- Crush Secondary Activities with These Killer Questions & Answers!
- Demystifying Water Resources: Class 12 Q&A for Exam Success!
- Think Like a Pro: Primary Activities Q&A for Class 12
- Class 12 Land Resources and Agriculture: Questions You NEED to Know!
- Mastering Human Development: Ace Your Class 12 Geography!